
At Football Behavior Management (FBM) we have developed a unique way of analyzing football data and statistics. Because football is a team sport we analyze all significant team achievements or setbacks and then measure every single individual player contribution to each specific achievement or setback.
We define significant team achievements as follows:
- Goals
- Assists
- Pre-assists
- Being able to work the ball significantly closer to the opponent’s goal
- Creating good opportunities without scoring
- Gaining space without the ball by forcing the opponent back through team pressure
- Winning and/or recovering the ball back
- Interrupting attacks
We define significant team setbacks as follows:
- Conceding a goal
- Allowing the opponent to move the ball significantly closer to the team’s goal
- Red and/or yellow cards
- Losing control of the ball
The way we analyze every team achievement or setback is by reverse engineering every step that led to the achievement or setback by reviewing the contribution every player made in that achievement or setback. For example: when Team A scores, we analyze who scored the goal, who assisted the goal, who pre-assisted the goal to all the way back to when the team managed to gain possession of the ball.
All contributions are then translated into the following indicators:
- Overall contribution (blue), which gives you the probability that a player will strengthen the team.
- Attacking contribution (orange), which gives you the probability that a player will strengthen the attack.
- Transitioning contribution (green), which gives you the probability that a player will strengthen the team during transition phases.
- Defensive contribution (red), which gives you the probability that a player will strengthen the defence.
FBM has a unique way of analyzing and presenting the data that we gather and break down over the course of every single minute of every single match. That way you can see how players perform during each match. Below you find an example of the contribution of Ajax player Hakim in Ziyech vs Feyenoord away in the Eredivisie.
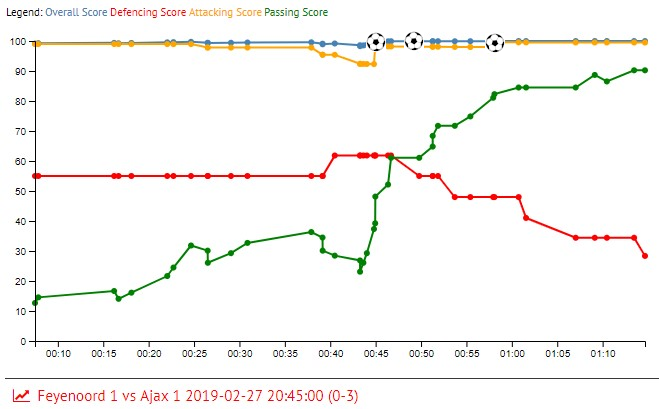
This chart makes it clear that Ziyech strengthens Ajax overall as well as attacking wise. Ziyech also had a good contribution for Ajax during transition phases in this specific match. Defensively Ziyech performed pretty well up until Ajax went 0-3 up. After the 0-3 you can clearly see his defensive contribution declining.
Importantly, most data is presented statically despite football being a very dynamic game. To appreciate the dynamics in which we can present FBM data, please watch this video of Ziyech’s FBM data from february 2018 till february 2019 which also includes his data from the 2018 World Cup. The video starts off showing Ziyech’s contribution at the end of the 2017/18 season and ends with match data of Ziyech during the 2018/19 season. The data clearly shows that Ziyech is contributing a lot more in 2018/19.
Proof that FBM data works
At FBM we have next to our statistical models for individual players also a model available to predict the outcome of football matches.
We don’t use any historical team data but use the individual player contribution data as shown above as input. When we have the lineups we can not only predict which team is going to win but also how dominant both teams will be and which team will create the most chances.
This model can also be used for scouting purposes. We are able to create fantasy lineups with your transfer targets and show what effect each potential signing will have on your team. We do this by taking your current starting XI and replacing one (or more) of your current players with potential signings after which the FBM data automatically recalculates and updates the overall strength of your team. It’s a perfect way of analyzing whether a potential signing will have a positive or negative impact on your team.
FBM predictions of match outcomes are statistically very sound with a p-value of p=0.005 which is very strong scientific proof that the predictions are correct.
Furthermore, with 50% correlation FBM median attack contribution (the orange line) is the best predictor for future goals scored by strikers in the upcoming season when compared to historic goals (8% correlation) or end of season xG (27% correlation).
Finally, the prediction error of FBM data is only 1.04% whereas the prediction error of the sports betting industry is 4.06%. FBM data has proven to consistently outperform the sports betting industry.
How to read a FBM player report
The FBM Score indicator is the main indicator in which can be seen whether a player is good enough or not. Our scores range from 0 to 10 with 0 being the worst score possible and 10 being the best. How we judge a player based on these scores is as follows;
- A mark of 8 and/or higher indicates that a player is exceptional.
- A mark between 5.5 and 8 indicates that a player is good.
- A mark between 2 and 5.5 indicates that a player still has to improve.
- A mark below 2 indicates that a player is not good enough.
The best match score indicator is from the player’s best performance of all matches analyzed by FBM.
The median match score indicator shows the consistency of a player. The player performs at least to a similar level but mostly better than the median match score in 50% of all FBM analyzed matches.
The worst match score indicator is data taken from the player’s worst performance.
The most recent match score indicator is data taken by FBM from the player’s most recent match.