Author: admin
-
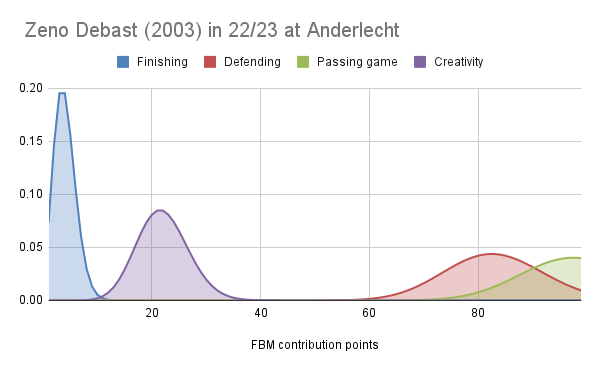
Revealed: Zeno Debast
We added Zeno Debast to our shadowlist of teenager born this century on 22-8-2022 and virtually paid 2M for him. Now he is moving to Sporting for 15.5M. In this tweet we recognized his talent: DM request: update on Zeno Debast. Last time we looked he played less than 1000 minutes. Now we have more…
-

Unified Scouting Language and AI
Unified Scouting Language is a set of specifications of player behaviors that are in line with the MARCO criteria of Organizational Behavior Management (OBM): Using Unified Scouting Language prevents the scout from overinterpreting what he sees into value judgements, attitudes, generalizations and status. In order to help scouts, especially new scouts, write correctly according to…
-

Revealed: Sergio Arribas
Sergio Arribas had a superstar performance in the Spanish tier #3 with maxed out finishing probability and very high passing game probability and even okayish defending probability. I put him in my shadow team on 19-8-2020 because he had an FBM player score of 6. Now he has an FBM player score of an 8.…
-
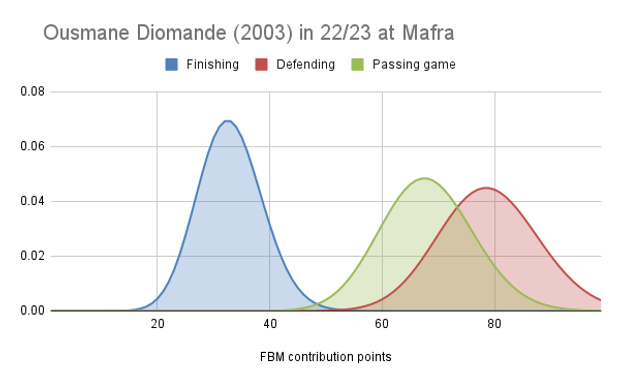
Revealed: Ousmane Diomande
Ousmane Diomande is a very good CB with high defending probability and high passing game probability. He must be great at building up. He even has decent finishing probability for a CB. Replacement value for #Mafra = €2,973,250. So he is very undervalued. Original Tweet
-
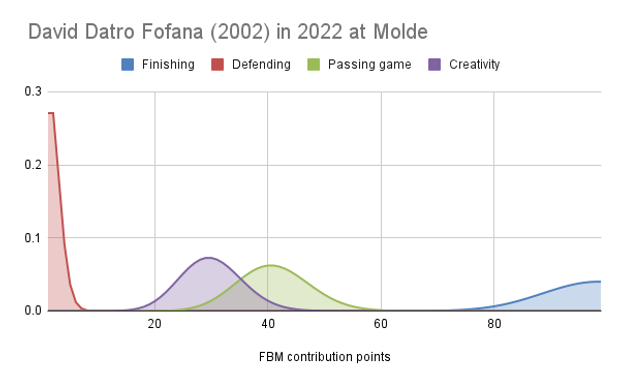
Revealed: David Datro Fofana
David Datro Fofana is still a very good striker still with maxed out finishing probability. Passing game probability dropped a bit though, although I doubt anyone cares that much about that. Replacement value for Molde = €2,400,753. Original Tweet David Datro Fofana is a very good striker with maxed out finishing probability and high passing…
-
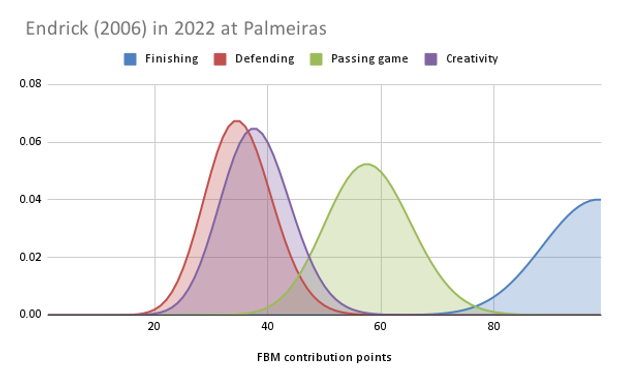
Revealed: Endrick
Yet, in the case of Endrick there is 1500 minutes of data which is more than enough. Endrick is a very good striker with maxed out finishing probability and decent decent passing game probability which is quite rare for a striker. Replacement value for Palmeira = €4,069,592. Original Tweet
-
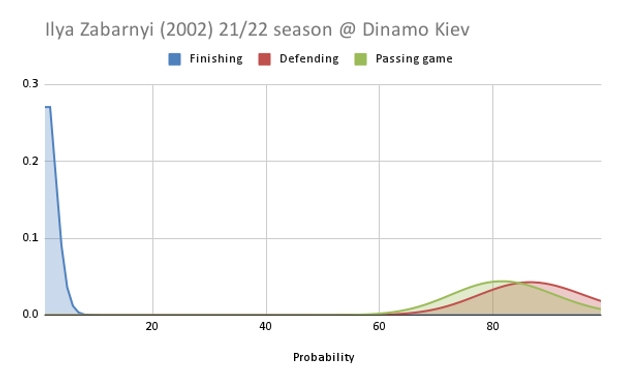
Revealed: Ilya Zabarnyi
Ilya Zabarnyi is a good CB. High defensive probalitity and high passing game probability. Original Tweet
-
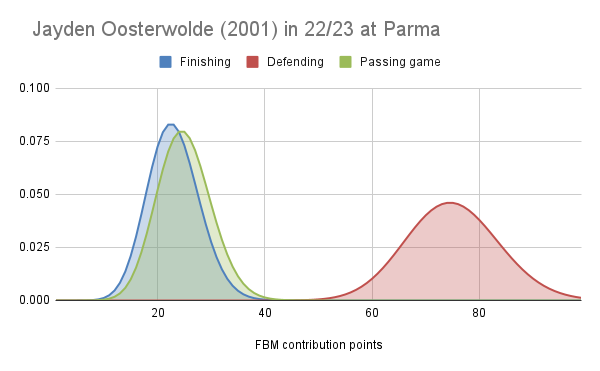
Revealed: Jayden Oosterwolde
Jayden Oosterwolde is an above par LB with high defending probability and a bit of passing game probability and finishing probability. Replacement value for Parma = €2,762,871. So he is slightly undervalued. Original Tweet
-
Revealed: Mykhaylo Mudryk
Mykhaylo Mudryk is a superstar in the Ukraine. His 22/23 stats are even better than his 21/22 stats although his previous FBM chart turned out, once again, to be highly predictive. Maxed finishing + very high passing game. RV for Chelsea = €35,090,464. Original Tweet Mykhaylo Mudryk is a very good winger with maxed out…
-
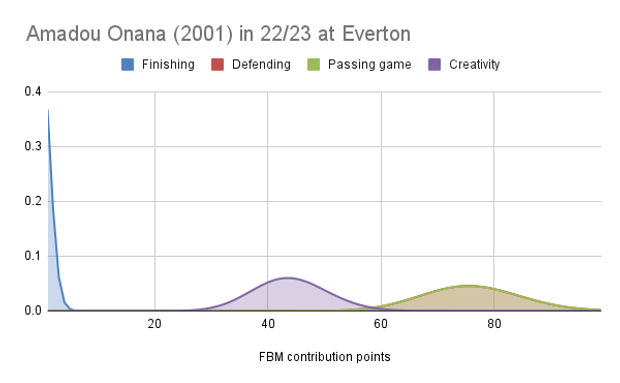
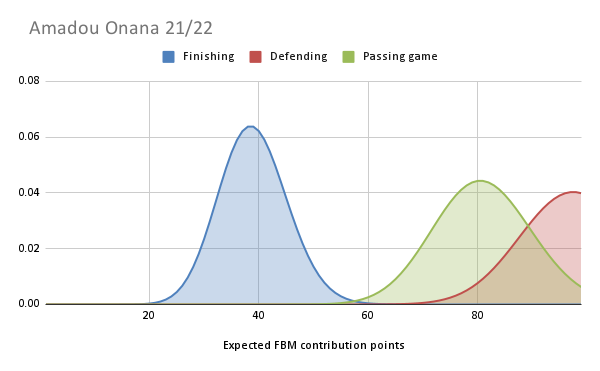
Revealed: Amadou Onana
Amadou Onana who is one of my reveals of my shadowlist when Everton paid 35M for him. Virtually I paid 400K for him making me a handsome, but virtual profit. Unfortunately, it seems #Everton has been using Amadou Onana as a CM. His drop in defending probability is probably due to this fact. Replacement value…