Category: Uncategorized

Accumulation of risk

How is it possible that big-name clubs suddenly experience a bad season, or even face relegation? In part, this can be attributed to bad luck. However, poor seasons typically result from the accumulation of risks. There are many different types of risks, and clubs need to be mindful of all of them. Yet, most clubs are primarily focused on pursuing success in sports or securing significant transfers. Only the smallest and weakest clubs put substantial effort into staving off relegation, while all others tend to aim higher rather than guard against potential failures. This optimistic approach, although commendable, is a risk in itself.

The problem with risk is that most people underestimate the cumulative impact of many small risks. Every decision a club makes carries an inherent risk. Each decision either increases or decreases the chance of a bad season, and the negative consequences of poor decisions may not surface within the same season the decisions are made. Let’s say a club has a 5% chance of a bad season; this means that the club, on average, faces a poor season once every 20 years. If this implies relegation, the repercussions could be significant. Risk equals chance multiplied by consequences. So, a 5% chance of a bad season with enormous negative consequences constitutes a substantial risk. If a club’s decisions within a season increase the chance of a bad season from 5% to 8%—a seemingly small increase—the club will experience a bad season once every 13 years on average. This underscores the fact that running a club is exceptionally challenging, as the margin for error is incredibly small.

In regular companies, a bad season typically translates into reduced revenue, but often there’s ample opportunity to rectify the situation. Consequently, the negative consequences of a poor season for most businesses are much less severe than for sports clubs. This also means the risks are considerably smaller, illustrating the complexity of managing a club compared to running a typical business.

A list of risks

Structural risks 

Complex Systems Science (CSS) and the Viable System Model (VSM) demonstrate that to manage the world’s complexity and ensure viability, every system—including clubs—must consider both running the business and developing the business. For the sporting aspect of a club, this implies that the first team staff is responsible for running the business, while the scouts handle the developing of the business.

Running the business entails striving for maximum efficiency, addressing present needs, and maintaining an inward perspective. This aspect of the business typically has a much shorter time horizon than business development. Efficiency means doing what we do well. For the first team that means playing as good football as possible.

On the other hand, developing the business is about fostering adaptability to equip the club to navigate changes both internally and in the external environment. It involves an outward-looking approach, prioritizing effectiveness over efficiency and engaging with the world outside the club as well as considering future implications. Effectiveness means researching whether what we do is the right thing to do. For the scouts that means how can we hire players to bring the club to the next level.

Structurally, every club faces two beneficial choices and one detrimental choice. The beneficial choices are as follows: either the manager of the first team also assumes responsibility for scouting and recruiting new players, or there is a clear delineation of duties between the sporting director—who handles scouting and recruiting—and the manager of the first team, who ensures that the team performs to the best of its potential. The bad choice is to have a sporting director who formally is responsible for scouting and recruiting, but who in reality is overruled by the manager of the first team. This increases risks as now the short term interest of the first team might overrule the long term interests of the club.

Procedural risks

Great scouts and sporting directors excel due to the comprehensive understanding of the game and the club they maintain in their heads. This means they are adept at making crucial decisions even in high-pressure situations. However, this approach does present a risk. People often overestimate their skills and underestimate the role of good fortune, while simultaneously underestimating their errors and attributing too much to bad luck. The best way to counter this risk is to establish clear procedures and adhere to them consistently.

The risk of success

Football is an immensely rewarding game when you achieve success, either sportingly or in terms of significant profits from a substantial transfer deal. Owing to positive reinforcement, we tend to do more of what rewards us and less of what leads to punishment. Therefore, if we achieve success through risk-taking, our brain becomes inclined towards further risk-taking—a risk in itself.

Let’s take a scenario where a sporting director hires a player that poses a greater risk than usual. However, everything goes well, and the club reaps an unexpected windfall from a multimillion-dollar transfer. Spurred by this success, the sporting director aims to replicate it and hires a player presenting an even bigger risk. This player doesn’t match the success of the first player, but neither does he cause significant issues for the club. Due to the lack of success, a so-called ‘extinction burst’ occurs. This is when someone tries exceptionally hard to replicate a previous success. As a result, the sporting director hires three more players who pose even greater risks. Unfortunately, everything falls apart, and the club suddenly faces serious problems. Everyone is taken aback by this development, but it could have been easily predicted due to the success of the first player, who was initially deemed a risk too large.

Lack of risk management

Risk management aims to reduce risk, and establishing such a system for clubs can be straightforward. It can be as simple as keeping track of how many sources, both within and outside the club, agree with a decision. Suppose a club has five scouts, a first-team manager, and a sporting director. If all seven agree that a player is highly likely to contribute positively to the club, the risk associated with hiring that player is lower than if these sources disagree among themselves. To prevent a large number of scouts from overruling the first-team manager, one could structure risk management in a more balanced manner. However, the basic idea remains: the more people in agreement, the smaller the risk.

Lack of measurement

Some individuals are averse to data analysis. While many criticisms can be leveled at the way data analysis is conducted in football, completely ignoring data also presents a significant risk. Strikingly, despite the vast amount of data collected on footballers’ performances, almost no club is measuring the performance of their scouts, recruiters, first-team managers, or sporting directors. Yet, setting up such measurements can be relatively simple.

Essentially, you ask every person involved in the scouting and recruiting process to predict how a new hire will perform at the club. Then, after each season, you assess whether that player has been a success or not. Finally, you measure the gap between the predictions and the player’s actual performance. These results are then fed back into the risk management system, assigning more weight to individuals who are good at predicting and less weight to those who are not as accurate. This approach enhances the system’s overall predictive power.

The risk of inconsistency

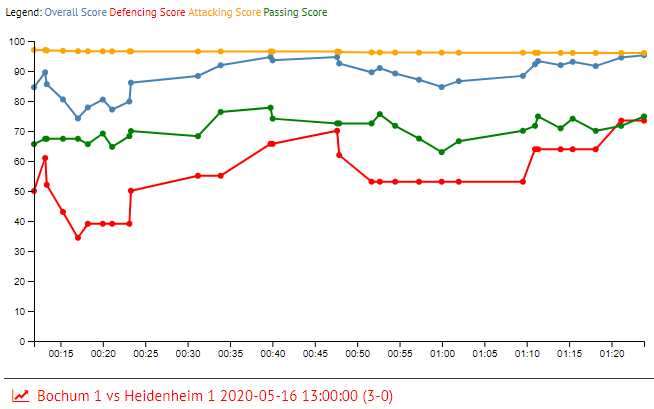
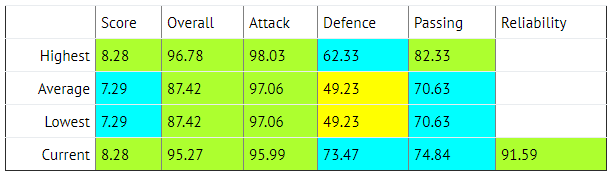
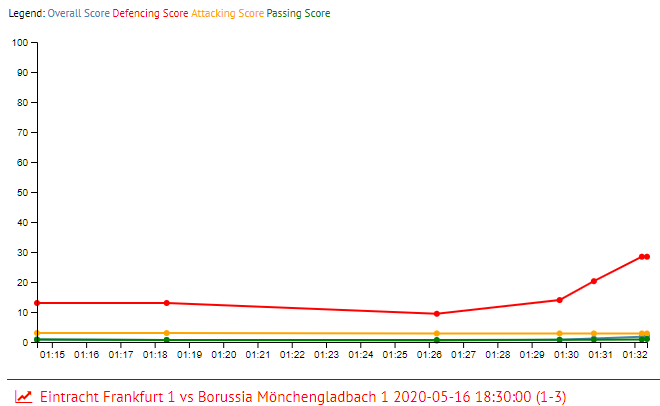
Some players exhibit remarkable consistency throughout their career, while others show marked inconsistencies. Data provides the most systematic method of assessing a player’s consistency. While live and video scouting can also offer insight into a player’s consistency, these methods are less systematic. The least risky players to recruit are those who consistently perform at a high level. Conversely, players who perform inconsistently pose a greater risk, and those who consistently underperform are the riskiest.

The risk of personality

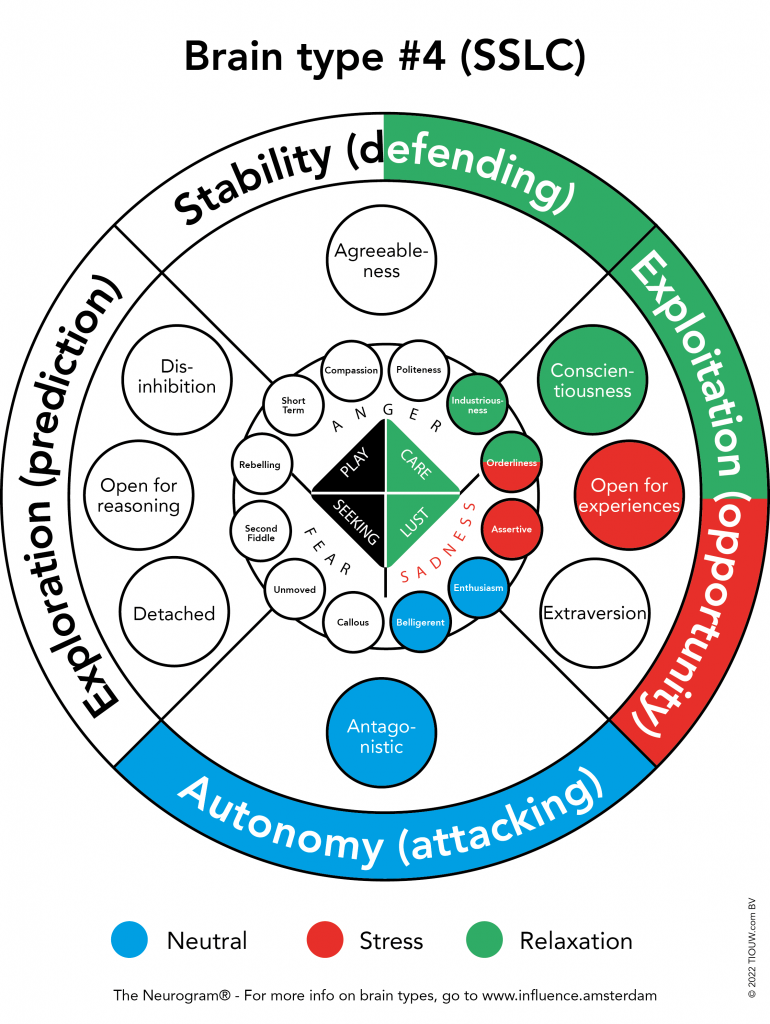
The Cybernetic Big Five Theory posits that personality, as we typically understand it, doesn’t really exist. Instead, what we refer to as personality is in actuality innate evolutionary behavioral patterns. Similarly to the existence of different body types in players, there are also different ‘brain types.’ Interestingly, some brain types may initially react adversely to each other. If aware of this, it’s something that can be overcome easily. However, if this is not understood, and there’s an adverse reaction in the brain of the team manager, he might misinterpret this negative feeling as an intuition not to start with that particular player. This misunderstanding can result in a suboptimal starting XI, hinder the player’s development, and lead to a loss of value for the club.

Risk management

Besides utilizing all the available internal and external resources for risk management, it’s also essential to explicitly address the aforementioned risks during player recruitment. This can be achieved in the following manner:

RiskPlayer APlayer BPlayer C
Structural risk (did the manager of the first team influence the decision beyond his mandate?)
Procedural risk (did we follow our own procedures?)
Risk of Success (are we overestimating ourselves due to past success?)
Lack of risk management (how many sources think recruiting this player is a good idea?)
Lack of measurement (did we use data to analyse the players and did we use a weighted risk management model based on the measurement of our scouts?)
Risk of inconsistency (did we check the player’s career for consistency?)
The risk of personality (do we know whether the player’s personality fits the team and the staff?)
Total risk

The personality of Sven Mislintat (type 4, SSLC)

Thanks to the insights of David of www.directoroffootball.com we determined that Sven Mislintat has a type #4 brain, the SSLC type. GPT agrees with us:

Sven Mislintat exhibits characteristics that are associated with Type 4. He is an idealist who holds strong personal principles, seeks recognition for unique contributions, is passionate about individual expression, socially engaged, outspoken, and willing to challenge authority. This aligns with Mislintat’s reputation as a highly respected and influential figure in the world of football scouting and recruitment. He has a history of being both cooperative and confrontational, which further supports the classification as Type 4.

Autonomy

Here are the reasons why Sven Mislintat scores high on autonomy based on his professional background and public perception:

  1. Professional Independence: Sven Mislintat has gained a reputation for being an independent thinker and decision-maker in the field of football scouting and recruitment. He has demonstrated a willingness to challenge traditional norms and authority figures, suggesting that he values his autonomy and is not easily swayed by others’ opinions or pressures.
  2. Innovative and Creative Thinking: Mislintat is known for his innovative approach to player scouting, often discovering young and talented players before they gain wider recognition. This ability to think outside the box and rely on his own judgment may contribute to a higher autonomy score, as he trusts his instincts and is willing to take calculated risks.
  3. Strong Analytical Skills: Autonomy can be associated with a preference for individual work and a focus on personal interests and ideas. Mislintat’s strong analytical skills and his ability to deeply analyze players’ performances and potential might indicate a higher inclination towards independent work and thought processes.
  4. Desire for Control: Autonomy is often linked to a desire for control over one’s work and environment. Mislintat’s high standards, meticulous approach, and dedication to his craft might stem from a desire to have full control over the scouting and recruitment processes, ensuring that his vision and values are upheld.

Please note that these are speculative reasons based on the limited information provided, and a comprehensive understanding of an individual’s personality requires a more in-depth assessment.

Antagonism

  1. Communication Style: Mislintat has a direct and no-nonsense style, this could be perceived as antagonistic by some, particularly in a field where diplomacy and tact are often required.
  2. Recruitment Decisions: Mislintat is making decisions that aren’t popular with certain factions within a club or the fanbase, this could lead to perceptions of antagonism.
  3. Conflict with Other Figures: As Mislintat is having disagreements or disputes with other figures in football, this could lead to perceptions of antagonism, particularly as those disagreements are public.
  4. Media Narrative: Sometimes, media narratives can shape perceptions of an individual. If there’s a narrative in the media painting Mislintat as antagonistic, this could influence how he’s perceived, regardless of his actual behavior.

Belligerent

  1. Strong Opinions: In his role, Mislintat may need to make and defend strong decisions or opinions about player acquisitions, strategies, or management. This can be perceived as belligerence, especially as he’s passionate and firm in expressing his views.
  2. Conflicts: As Mislintat has been involved in public disputes or conflicts, this could contribute to a perception of belligerence. This is especially the case as these disputes are frequent or high-profile.
  3. Leadership Style: Some people have a more confrontational leadership style, which can be effective in some situations but can also be perceived as belligerence.
  4. Media Perception: The media can significantly influence how individuals are perceived, especially in high-profile fields like football. As the media portrays Mislintat as belligerent, it could contribute to this perception, regardless of his actual behaviour.

Enthusiasm

  1. Passion for Football: Mislintat’s job involves identifying and recruiting talented players. His enthusiasm could be reflective of his passion for the sport and for discovering new talent.
  2. Job Satisfaction: As Mislintat genuinely enjoys his work and feels fulfilled by it, this would naturally lead to high levels of enthusiasm. His love for the scouting and strategic elements of his role might contribute to his enthusiasm.
  3. Personal Characteristic: Some people are naturally more enthusiastic than others, irrespective of their job or their situation. Mislintat might be one of these people who simply exude energy and passion.
  4. Communicative Style: As Mislintat communicates in an energetic and engaging manner, this could also be perceived as enthusiasm.
  5. Professional Success: As Mislintat has had recent professional successes, such as successful recruitment of high-performing players, this could also boost his enthusiasm level.

Relative strength MLS

Here is the list of the relative strength of teams in the MLS based on their performance in the previous season according to Wyscout data. If it were a simple competition than this would also be our prediction for the league table. Previously predictions like these have had a 80% correlation with the actual league table a year later. So will see how it goes for the MLS:

RankFBM Wyscout score
1Atlanta73
2Los Angeles72
3Salt Lake71
4Toronto70
5Dallas67
6New York City65
7Columbus63
8Seattle62
9Portland61
10Chigago57
11Minnesota56
12San Jose56
13Colorado54
14New England54
15LA Galaxy52
16Montreal51
17Philadelphia50
18Kansas City48
19DC45
20Orlando42
21New York RB40
22Houston37
23Vancouver36
24Nashville35
25Cincinnati30
26Miami19

Showcase: Niklas Dorsch

Niklas Dorsch is a defensive midfielder of Heidenheim, playing in 2. Bundesliga. Dorsch has been on our radar for the last couple of years and with only one year left at Heidenheim, he is an interesting player to follow. He plays for Germany U21. We think he would do well in 1. Bundesliga. For that reason we show here that he would be a good addition to Eintracht Frankfurt.

Dorsch at Heidenheim

Here is Dorsch’ most recent FBM contribution chart:

Although Heidenheim lost and Dorsch did not play his best match, especially in the first half as can be seen from his contribution chart, he is still an exceptional player according to his FBM stats:

Yet, these are his stats for playing in the 2. Bundesliga. How would he do at Eintracht Frankfurt? We think that Dorsch is a good replacement for Hasebe at Eintracht Frankfurt. Hasebe’s most recent contribution chart shows he is not playing well at the moment:

Also his FBM stats are less than those of Dorsch:

Dorsch is slightly better than Hasebe at their highest performance, but Dorsch beats Hasebe on average performance, current performance and worst performance. Yet, Hasebe plays on a higher level. So we have to take that into account.

Dorsch playing for Eintracht Frankfurt

Taking into account minutes played, difference between both clubs and both competitions, we get the following results for Dorsch playing at Eintracht Frankfurt:

What you see in the first row, is the performance level of Eintracht Frankfurt in the 1. Bundesliga. In the second row we subtract Hasebe’s contribution to the performance of Eintracht Frankfurt. That is only a small difference because Hasebe is not contributing that much on average. In the third row we add Dorsch to the expected performance of Eintracht Frankfurt. Finally, we can see how Eintracht Frankfurt’s performance would increase or decrease in row 4. Overall performance of Eintracht Frankfurt would rise as would attack and transitioning. Defensive performance would suffer slightly.

Eintracht Frankfurt’s FBM Team Score would increase to 115 points up from 102 points. There is an 80% correlation between FBM Team Score and future ranking in the league. If other teams would not improve Eintracht Frankfurt would rise to rank 10 in the league table if they played with Dorsch rather than Hasebe.

What is Dorsch worth?

Our model takes into account, position, highest transfer fee in the current season, record transfer fee, difference in competition, club, player age and length, international status and FBM stats. Due to the Corona crisis, it is much more uncertain how future transfer fees will develop. Our model is still based on the pre-Corona circumstances. 

When we calculate what we call the replacement fee for players. This is the amount of money the current employer of the player can expect to spend on a replacement who is as good as their current player. In short: clubs should not transfer players for less than the replacement fee, nor buy players for more than the replacement fee. As the replacement fee differs from club to club, there is room for negotiations. We also calculate what the player would be worth one year later if he is able to transfer to an even better club. All assuming his FBM stats remain the same.

Here are the replacement values for Dorsch:

Replacement value for Heidenheim£2,592,419
Replacement value for Eintracht Frankfurt£3,861,435
Replacement value for Schalke 04£6,672,353

TransferMarkt currently values Dorsch at £4.05m. We think that Dorsch is slightly overvalued on TransferMarkt. If Eintracht Frankfurt were able to buy Dorsch for less than £3,861,435, they would have a good deal. A deal that might make them almost £2m a year later, if they would transfer Dorsch to the next club and Dorsch would perform at the level we expect him to do. As a reminder, we predicted that Dalmau would be worth 1.75m euro to Heracles and they transferred him a year later for 1.7m euro.

For us the most important thing about FBM stats, is that we calculate the probabilities that a player is able to contribute to a specific team. Here are the probabilities that Dorsch is able to contribute to Eintracht Frankfurt:

Probability that Dorsch contributes to Frankfurt63
Probability that Dorsch contributes to the attack of Frankfurt72
Probability that Dorsch contributes to the defense of Frankfurt25
Probability that Dorsch contributes to the transitioning & build up of Frankfurt46

Case study: Watford

Many scouts wonder why their advice is being ignored by the higher ups. The reason is that whatever scouting report they have drawn up, their report fails to answer the most important question:

What is the probability that player X is able to contribute to the team?

The answer is a number between 0% and 100%. This answer is never given in any of the reports or presentation scouts give. That means that the decision makers have to calculate this answer based on the report the scout has provided. Of course, they never do this consciously. Yet, our brain makes these kinds of estimations unconsciously all the time. If a scout does NOT explicitly answer this question, the brain of the decision maker is going to make the probability estimation all by himself. In almost all cases, this estimation will be lower than the players the decision maker prefers himself. That is the reason why even the most successful scouts only have contributed to a handful of transfers. Most transfers happen for other reasons than provided by the scouting team.

It really doesn’t matter whether we are talking about data, video or live scouting. If the final report fails to answer the question about the probability that a player is able to contribute to the team, the decision maker is going to answer that question and probably in a less favorable way.

So let’s look at an example. If you are using Wyscout data as a data scout, how can you then answer this most important question: 

What is the probability that player X is able to contribute to the team?

First you need to build a model that transforms Wyscout data into probabilities. Bayesian networks are most suitable for this job, but there are other ways. We prefer to use Bayesian networks. Second step is to validate your model. For validation we have created a Bayesian network to transform Wyscout team data into team probabilities. We calculate the following four probabilities:

  1. What is the probability that a team is going to perform well?
  2. What is the probability that the attack of the team is going to perform well?
  3. What is the probability that the defense of the team is going to perform well?
  4. What is the probability that the passing game of the team is going to perform well?

Here are the results for the Premier League and Watford:

Validation comes from the 89% correlation (R2=80%) between the probability to perform well and the rank of the team. This is in line with this correlation in other competitions. So to be clear: 

  1. The probability of Watford to perform well is 38%
  2. The probability of Watford to attack well is 37%
  3. The probability of Watford to defend well is 54%
  4. The probability of Watford to pass well is 47%

The next step is to look at the individual players of Watford. Normally we would look at all the players (except the keeper), but for this exercise we only look at the most recent starting XI:

Again, these stats answer the following four questions:

  1. What is the probability that a player is able to contribute to the team?
  2. What is the probability that a player is able to the attack of the team?
  3. What is the probability that a player is able to the defense of the team?
  4. What is the probability that a player is able to contribute to the passing game of the team?

As long as a player has at least one of these four probabilities quite high, he is an asset to the team. Of course, if it is only one category, he is a specialist rather than a generalist, unless that category is the overall category.

Taking into account minutes played we can then calculate the contribution each player has made to the team probabilities of Watford:

The contribution of these ten players is:

Here one can see that although Sarr has quite weak data in Wyscout, his contribution to the attack of Watford is on par to what is expected of him.

One can also immediately see that Pereya is the weakest link. So let’s look at a replacement for Pereya. As this is an example only, I am going to use a replacement who obviously would be better suited than Pereya. The player I am going to use is Liverpool’s Mané.

Here we use our transfer model. This gives the following results:

Let me explain this. First we start with the probabilities of Watford and Pereya we have already seen. Taking into account minutes played, we subtract Pereya from the probabilities of Watford. What this means for Watford is that the probability to perform well remains unchanged, but the probabilities to attack, defend and pass well drop a bit. 

Then we look at the probabilities of Mané playing at Liverpool. As you can see, for all but defense, these probabilities are much higher than Pereya’s probabilities. But in part, Mané is playing well at Liverpool because he is playing together with other great players. That won’t be the case if he transfers to Watford. So we have to take into account that his performance will drop a bit. But how much? Fortunately, we have a Bayesian model to calculate precisely that by taking into account the relative strength of both teams and minutes played. To make it explicit:

  1. The probability that Mané is able to contribute to Watford is 87%.
  2. The probability that Mané is able to contribute to the attack of Watford is 98%.
  3. The probability that Mané is able to contribute to the defense Watford is 5%.
  4. The probability that Mané is able to contribute to the passing game of Watford is 52%.

What this would mean for Watford is that their probabilities also go up when we add Mané with his Watford probabilities to Watford as is shown in the final row. With Mané playing for Watford the new probabilities for Watford are:

  1. The probability of Watford to perform well is 45%
  2. The probability of Watford to attack well is 43%
  3. The probability of Watford to defend well is 46%
  4. The probability of Watford to pass well is 55%

GIven the correlation between overall team performance probability and rank, we can also see that Watford would rise to somewhere between rank 10 and rank 15 in the competition once Mané is playing for Watford. 
Rational decision makers use these kinds of models to calculate for every player they are seriously considering hiring what the probability is that the player is able to contribute to the team and what this means for the team. Once you have ranked all players according to their probability to be able to contribute to the team, you try to hire the best player available. That is how we were able to transfer Dalmau to Heracles for instance.

This is the kind of work that we are going to teach at the Football Behavior Management summer school at the VU-university in Amsterdam in juli 2020. Due to the current circumstances this will be an online course.

Wyscout data to Bayesian team ranking

Without live matches I found time to work on my third iteration of my Bayesian model to turn Wyscout data into Football Behavior Management (FBM) data. To be clear: we only accept correlation above 80% and R2 above 60%. So far all 7 competitions checked have a correlation of at least 80% and sometimes it goes up till an astonishing 95%!

The Wyscout team data we use are:

  • Average goals scored
  • Average goals conceded
  • Shots off Target
  • Shots on Target
  • Passes inaccurate
  • Passes accurate
  • Recoveries (low, medium, high)
  • Losses (low, medium, high)
  • Challenges failed
  • Challenges won

Als please note that we use team data for these correlations that can NOT be traced back to individual players. Unlike the correlations we get with FBM probabilities that are based on stats of individual players and that can be traced back to these players.

Premier League

RankPointsFBM Wyscout scoreFBM Wyscout AttackFBM Wyscout PassingFBM Wyscout Defense
Liverpool19984707454
ManCity28193728353
ManUnited36677636651
Chelsea46676547451
Leicester56275606652
Tottenham65964546249
Wolves75961545850
Arsenal85664527947
Sheffield95452535450
Burnley105441444850
Southampton115244445149
Everton124945425747
Newcastle134433365147
Crystal144336365447
Brighton154149406248
West Ham163944435448
Aston Villa173533365246
Bournemouth183433355346
Watford193431335147
Norwich202125235944
Correlation with rank 93% (R2=88%) and points 90% (R2=81%)

Bundesliga

RankPointsFBM Wyscout scoreFBM Wyscout AttackFBM Wyscout PassingFBM Wyscout Defense
Bayern16193738054
Dortmund25789697852
Leipzig35484706852
Leverkusen45380607350
Gladbach55269606149
Wolfsburg63951485450
Freiburg73750455749
Schalke83745415847
Hoffenheim93651408047
Koln103444435448
Hertha113443435546
Augsburg123033414646
Berlin133033384848
Frankfurt142846435450
Mainz152730345145
Dusseldorf162431315547
Bremen172131305744
Paderborn181831345444
Correlation rank = 91% (R2=82%) and points = 96% (R2=93%)

Bundesliga 2

RankPointsFBM Wyscout scoreFBM Wyscout AttackFBM Wyscout PassingFBM Wyscout Defense
Bielefeld15380656751
HSV24675606849
Stuttgart34575547350
Heidenheim44456515649
Darmstadt53952495549
Aue63846495147
Kiel73855486048
Greuther83751505447
Hannover93545387650
Regensburg103434444447
St. Pauli113348465547
Bochum123246445647
Osnabruck133042435347
Sandhausen143042415250
Nurnberg153040385448
Karlsruher162833394648
Wiesbaden172833394748
Dresden182430404447
Correlation rank = 88% (R2=78%) and points = 93% (R2=87%)

Bundesliga 3

RankPointsFBM Wyscout scoreFBM Wyscout AttackFBM Wyscout PassingFBM Wyscout Defense
Duisburg15164546150
Mannheim25065566150
Bayern II34851436445
Braunschweig44850525049
Unterhaching54757545450
Wurzburger Kickers64751515249
Ingolstadt74654535151
1860 Munchen84652515349
Hansa Rostock94555517351
Uerdingen104445445548
Meppen114351525248
Kaiserslautern124149485349
Viktoria Koln133852446346
Magdeburg143756515452
Chemnitzer153747485248
Zwickau163636484247
Hallescher173349445749
Munster183338435046
Sonnenhof192524284847
Jena201825295046
Correlation rank 79% (R2=62%) and points 85% (R2=73%)

Eredivisie

RankPointsFBM Wyscout scoreFBM Wyscout AttackFBM Wyscout PassingFBM Wyscout Defense
Ajax15687697253
AZ25688707651
Feyenoord35075606850
PSV44972576650
Willem II54450505448
Urecht64172606449
Vitesse74160535949
Heracles83656535648
Groningen93554477452
Heerenveen103354466148
Sparta113343465147
Emmen123247396247
VVV132826305046
Twente142747406246
Zwolle152643386046
Sittard162636385446
ADO171926315046
RKC181532296045
Correlation with rank 91% (R2=83%) and correlation with points 92% (R2=85%)

Jupiler Pro League

RankPointsFBM Wyscout scoreFBM Wyscout AttackFBM Wyscout PassingFBM Wyscout Defense
Club17074616353
Gent25574606651
Charleroi35463645051
Antwerp45356555350
Standard54959535849
Mechelen64448485448
Genk74452446147
Anderlecht84374596849
Zulte93647447546
Mouscron103349455748
Kortrijk113345455448
STVV123343376245
Eupen133033335447
Cercle142331315446
Oostende152224324645
Waasland162019235144
89% correlation with rank (R2=80%), 89% correlation with points (R2=79%)

Dutch Eerste Divisie

RankPointsFBM Wyscout scoreFBM Wyscout AttackFBM Wyscout PassingFBM Wyscout Defense
Cambuur16681716252
Graafschap26274645953
Volendam35567556449
Jong Ajax45473596847
NAC55064555951
Go Ahead64851535247
Excelsior74749525247
NEC84561565849
Almere94450497151
Telstar104448455846
Den Bosch113860526247
Jong Utrecht123845505046
Eindhoven133440415446
Jong AZ142848406544
MVV152730384646
Top Oss162533325646
Roda JC172234395046
Jong PSV182245376544
Dordrecht192031325445
Helmond Sport201720254845
91% correlation with rank (R2=83%) and 88% with points (R2=78%)

Showcase: Noa Lang

Noa Lang first gotten on our radar January 22nd 2018, almost two years ago. This is his FBM contribution chart at that time of that match:

Jong Ajax vs Cambuur January 22nd 2018 (3-2)

Compared to his most recent FBM contribution chart, the only difference is that Noa Lang today has a higher transitioning & build up then two years ago:

Ajax 1 vs FC Utrecht 1 2019-11-10 12:15:00 (4-0)

Given Noa Lang’s high attacking contribution it comes as no surprise that Noa Lang scored a hattrick in the match FC Twente vs Ajax of December 1st 2019.

Showcase Sergiño Dest

Bayesian statistics, like FBM uses, needs way less data than before you can draw valid conclusions. That makes Bayesian statistics ideal for scanning youth players for talents. Sergiño Dest is a great showcase in this regard. According to Ronald Koeman, the current manager of the Dutch national team, one and a half a year ago it was not known what a great talent Dest was. Of course, this is not the case. Quite a number of professionals knew what a talent Dest was, even in the early years.

FBM for instance created this FBM contribution chart for Dest in April 2017, two and a half years ago:

Ajax U17 vs Bayern München U17 April 17th 2017 (2-0)

An FBM contribution chart that is quite the same as the chart of his most recent full game:

Ajax 1 vs Feyenoord 1 2019-10-27 16:45:00 (4-0)

With the exception of the much higher green line representing the probability that Dest is able to contribute to the transitioning & build up of Ajax. Yet, Dest’s increase in performance in transitioning and build up is very recent. A month earlier his FBM contribution FBM chart still looked like this:

Ajax 1 vs Fortuna Sittard 1 2019-09-25 20:45:00 (5-0)

It is very hard for players to do well on transitioning & build up (the green line) in our FBM system. When they do, they often become the talk of the town. So what happened with Dest is not that his talent wasn’t recognized, but that he only very recently started to play at an exceptional level. That is the reason why you use Bayesian statistics, like FBM, to keep track of talented youth players and at the same time combine that information with scouts with a proven track record for being good at predicting the progression youth players make. Then you are not surprised or disappointed when a star player chooses to play for a different national team than for the country where he grew up.

Our prediction of the Eredivisie Winter Champion 19/20

As there is an 80% correlation between FBM Team Score and the ranking in the Eredivisie and a 90% correlation between FBM Team Score and points scored in the Eredivisie, we can predict what the ranking of the clubs and the points they score. As teams that risks to be regulated can buy players that make significantly difference in the team’s performance, we can really only predict the ranking and points on January 1st 2020. In principle the same goes for any player still bought before the close of the summer transfer window, but in practice this will make very little difference to our prediction, if at all.

So without further ado, here is our definite prediction for the Eredivisie season 19/20:

RankClubAverage FBM Team ScorePoints 1/1/2020Points end of 19/20 seasonAverage points previous 5 yearsDifference
1Ajax239.54385850
2PSV197.5357079-9
3AZ160.5295767-10
4Utrecht160295761-4
5Feyenoord156.52855541
6Vitesse1442651510
7Willem II137.52549463
8Twente133244748-1
9Heerenveen1302346442
10VVV121.5224345-2
11Sparta112203940-1
12ADO111.52039381
13Emmen1112039412
14Groningen103.51836360
15Zwolle1011835314
16Fortuna961734331
17Heracles891631283
18RKC84.451530228

Explanation

This is what the columns mean in the above table:

  1. Average FBM Team Score. FBM Team Score is calculated by adding all the values of the players in the starting XI to the team score at the end of each match. This includes all the data we have of the team from the previous two seasons and the start of the new season. Older matches have less weight and recent matches weigh more.
  2. Points 1/1/2020. This is the predicted number of points that team will probably have January 1st 2020.
  3. Points end of 19/20 season. This value is only provided so we can check whether the values are in line with the average of the last five years for each position. Due to changes in the team during the winter transfer period, these values are only a prediction if no team changes anything during the winter transfer period which is of course extremely unlikely.
  4. Average points in the previous 5 seasons. This is the average points for the rank not for the club. For example, the champion in the Eredivisie had 85 points , on average over the previous 5 seasons.
  5. Difference. This is the difference between the 5 year average and our projected points for the end of the season. This shows how likely it is that we overestimate or underestimate the club. So we are likely to underestimate the number two of the Eredivisie and if that it is PSV, which is also likely, then we are underestimating PSV. And we are probably overestimating number 18, which in all likelihood won’t be Heracles, but one of the other teams just above Heracles.

Notes

  1. In our projection the teams score 6 less points than the 5 year average which is less than 1% difference of the 849 total points scored in the 5 year average.
  2. Although the model predicts the top two in the same way as most people would do, there is an anomaly in the sense that the number two of the Eredivisie would score significantly less than on average. This could be the case as the favorite teams in the Eredivisie had a rocky start of the season. Nevertheless, it is more likely that our model underestimates PSV currently.
  3. In the same light, our model seems to underestimate the upper half of the table and overestimate the bottom half of the table.
  4. The other anomaly would be the regulation of RKC with 30 points. Although it is likely that RKC will be regulated, 30 point is quite a high number of points to still be regulated. So it is likely that our model overestimates RKC.
  5. If clubs are predicted to score the same or almost the same number of points then it is obvious that the smallest change might affect whether one club is on top of the other or vice versa. For instance, we predict ADO to be on top of Emmen, but it could very well be the opposite.
  6. As this is the first season we make this prediction we have to see how clubs that are promoted from the Eerste Divisie do in this prediction. We use a deflator for historical games in the lower league, but even with the deflator promoted clubs do quite well. So we might overestimate promoted clubs. Nevertheless, Twente and Sparta did have a great start to the season.

Our prediction of the Eredivisie Winter Champion 19/20 – Preview

Please note: this is a preview of our prediction that we will make once the transfer window is closed September 2nd 2019. Yet, we don’t expect much to change between this preview and the final prediction. I will update this article once the transfer window is closed.

As there is an 80% correlation between FBM Team Score and the ranking in the Eredivisie and a 90% correlation between FBM Team Score and points scored in the Eredivisie, we can predict what the ranking of the clubs and the points they score. As teams that risks to be regulated can buy players that make significantly difference in the team’s performance, we can really only predict the ranking and points on January 1st 2020. In principle the same goes for any player still bought before the close of the summer transfer window, but in practice this will make very little difference to our prediction, if at all.

So without further ado, here is our prediction for the Eredivisie season 19/20:

RankClubAverage FBM Team ScorePoints 1/1/2020Points end of 19/20 seasonAverage points previous 5 yearsDifference
1Ajax236.5428385-2
2PSV192.5346779-12
3Utrecht173.5316167-6
4AZ162.5295761-4
5Feyenoord153.52754540
6Vitesse142255051-1
7Willem II1372448462
8Heerenveen134244748-1
9VVV1302345440
10Twente1152040452
11Emmen114.5204040-1
12Sparta111203938-1
13RKC109193841-6
14Groningen102.51836360
15ADO971734313
16Zwolle961734331
17Fortuna90.51632284
18Heracles85.51530228

Explanation

This is what the columns mean in the above table:

  1. Average FBM Team Score. FBM Team Score is calculated by adding all the values of the players in the starting XI to the team score at the end of each match. This includes all the data we have of the team from the previous two seasons and the start of the new season. Older matches have less weight and recent matches weigh more.
  2. Points 1/1/2020. This is the predicted number of points that team will probably have January 1st 2020.
  3. Points end of 19/20 season. This value is only provided so we can check whether the values are in line with the average of the last five years for each position. Due to changes in the team during the winter transfer period, these values are only a prediction if no team changes anything during the winter transfer period which is of course extremely unlikely.
  4. Average points in the previous 5 seasons. This is the average points for the rank not for the club. For example, the champion in the Eredivisie had 85 points , on average over the previous 5 seasons.
  5. Difference. This is the difference between the 5 year average and our projected points for the end of the season. This shows how likely it is that we overestimate or underestimate the club. So we are likely to underestimate the number two of the Eredivisie and if that it is PSV, which is also likely, then we are underestimating PSV. And we are probably overestimating number 18, which in all likelihood won’t be Heracles, but one of the other teams just above Heracles.

Notes

  1. In our projection the teams score 6 more points than the 5 year average which is less than 1% difference of the 849 total points scored in the 5 year average.
  2. Although the model predicts the top two in the same way as most people would do, there is an anomaly in the sense that the number two of the Eredivisie would score significantly less than on average. This could be the case as the favorite teams in the Eredivisie had a rocky start of the season. Nevertheless, it is more likely that our model underestimates PSV currently.
  3. In the same light, our model seems to underestimate the upper half of the table and overestimate the bottom half of the table.
  4. The other anomaly would be the regulation of Heracles with 30 points. This is quite a high number of points to still be regulated. Even though there is an 80% correlation between FBM Team Score and league ranking, our model put Heracles at place 12 whereas in reality they ended the league in place 6. So it could be that our model systematically underestimates Heracles. On the other hand with 30 points Heracles still gets a lot of points. It is just that other teams get more points. So it could very well be that the race against regulation could be a very tight race this year with a lot of clubs remaining under threat of regulation for a very long time. If this prediction is an indication for the coming season, it will be a very busy winter transfer window with clubs rushing to buy players to prevent regulation.
  5. If clubs are predicted to score the same or almost the same number of points then it is obvious that the smallest change might affect whether one club is on top of the other or vice versa. For instance, we predict Twente to be on top of Emmen, but it could very well be the opposite.
  6. As this is the first season we make this prediction we have to see how clubs that are promoted from the Eerste Divisie do in this prediction. We use a deflator for historical games in the lower league, but even with the deflator promoted clubs do quite well. So we might overestimate promoted clubs. Nevertheless, these two of the three promoted clubs did have a great start to the season.