Our FBM analysis can easily been done in real time. That means that our model to calculate the domination by each team and the chances to score for each team, is updated live during the match. This allows one to see which substitutes are increasing domination and chances. And which substitutes decrease domination and chances.
The procedure is as follows:
Step 1: match preparation:
Before the match and before the starting XI are known, we set up both teams with either their previous starting XI or the most likely starting XI. Here we use the FBM tool in the same way as we do for scouting to see how a potential new player strengthens the team or not. Or how we use the tool to help the manager finds the most effective starting XI in match preparation.
For instance, here is an example of the match The Netherlands vs England in the quarter finals of the Nations League. This example is used as this happened the be a real case when we trained a group of ten managers in Barcelona on the day of the match.
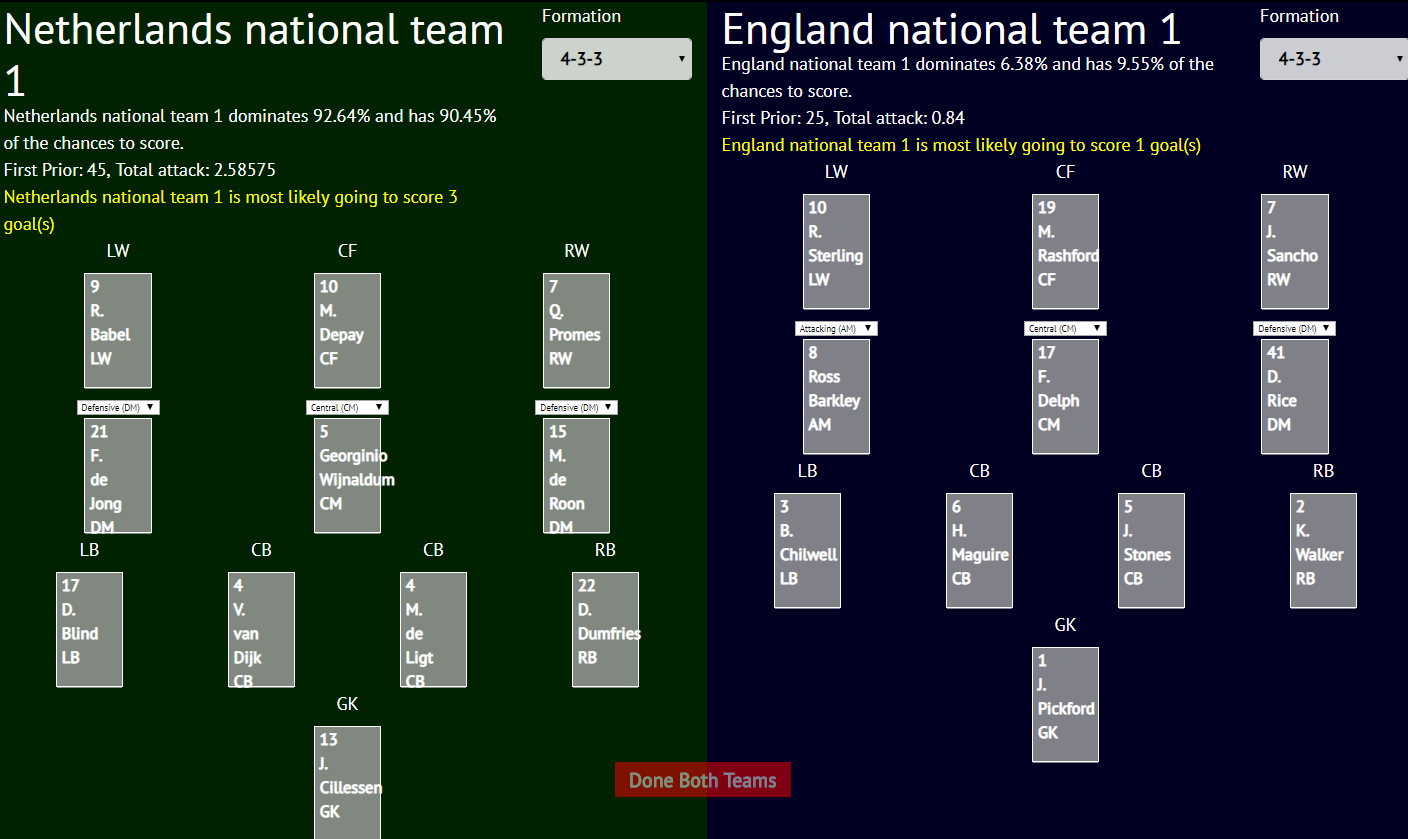
The FBM tool predicts a 3-1 win for the Netherlands which is nice as the result of the real match also was 3-1. But this is based upon us starting with Promes rather than Bergwijn.
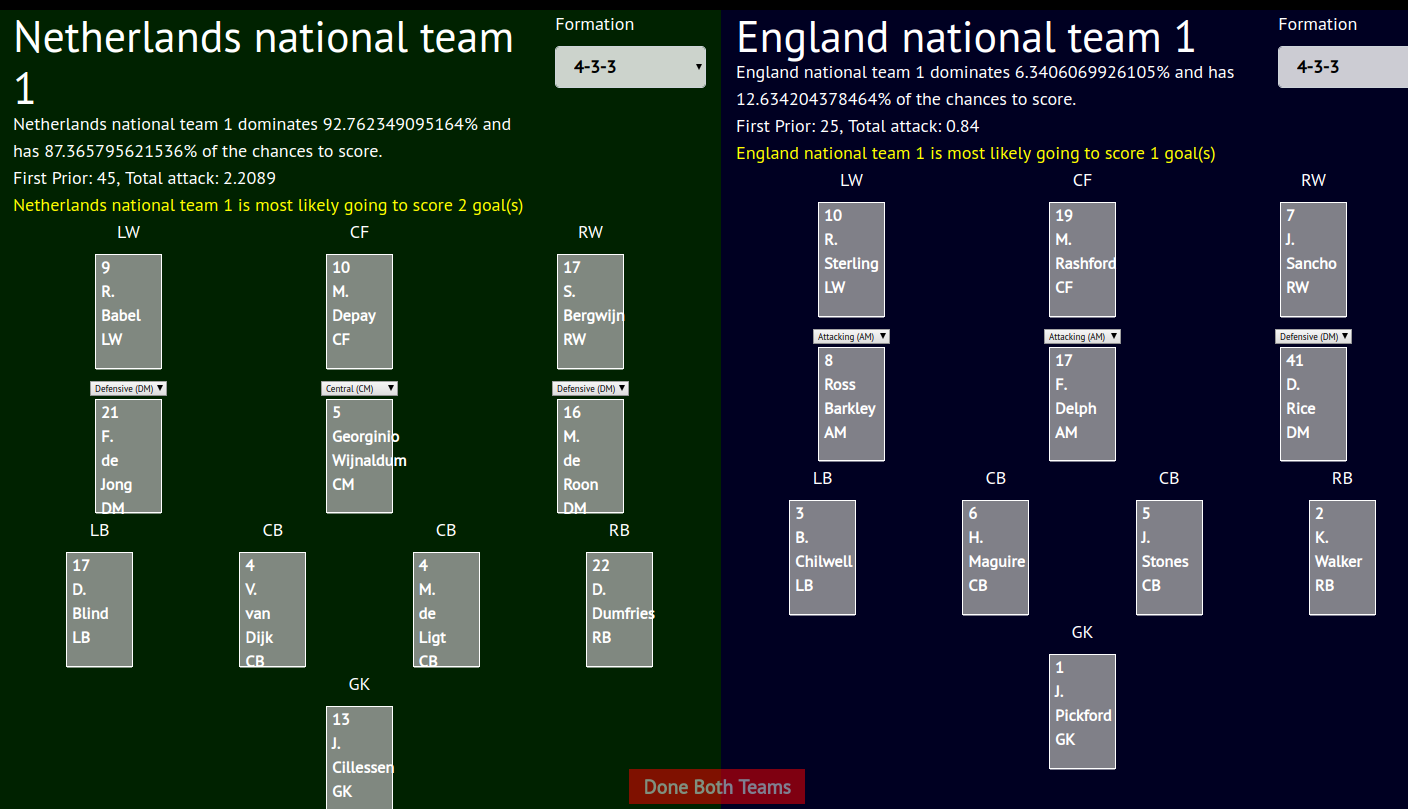
Step 2: Update the line ups with the actual XI
Once the real starting XI are known we update the tool. In our example we substitute Promes for Bergwijn. Now the FBM tool predicts a 2-1 win rather than a 3-1 win, reflecting the lesser attacking efficiency of Bergwijn in regard to Promes.
Step 3: real time analysis
Once the match starts we use two analysts – one for each team – to use our proprietary way of analyzing a match in real time, as explained here. Basically, whenever a player contributes to more good results than bad results on the pitch, the chance for that team to dominate increases. And vice versa. If a player contributes to more good attacking results than bad attacking results, the chances to score for that team increases. And vice versa. This is of course obvious, but the trick is to build the correct model to reflect this.
Step 4: select candidates for substitution
It is extremely rare for all eleven players of the starting XI of a team to all to contribute more to good results than bad results. This means that with real time FBM statistics we immediately see which players on the field hinder the team rather than help the team. As FBM statistics is very sensitive this already becomes obvious to the analysts after twenty minutes or so. It is rare for player – although it does happen – to change their performance in the second half.
Step 5: compare candidates for substitution with available players on the bench
Even though a player on the pitch is performing badly, it doesn’t automatically follow that a player on the bench would do better. So the analyst compares candidates for substitution that are currently playing with players on the bench. As soon as the performance of a player on the field drops below a threshold set before the match, substituting that player is going to increase the odds that the team will win.
So at half time the analysts present the manager of the team with a list of players that are the best candidates for substitution and which substitutions increase the chance to win the most. The manager is also presented with a list of the opponent to show which players are performing most badly and which opposite players are performing well.