Most people have heard that correlation is not causation. Yet, almost no-one has heard that correlation is not correlation. Technically, correlation only establishes a measure of how much two lines are similar to each other. This measure of similarity is not even undisputed as it uses the least square method of the regression of the two lines involved.
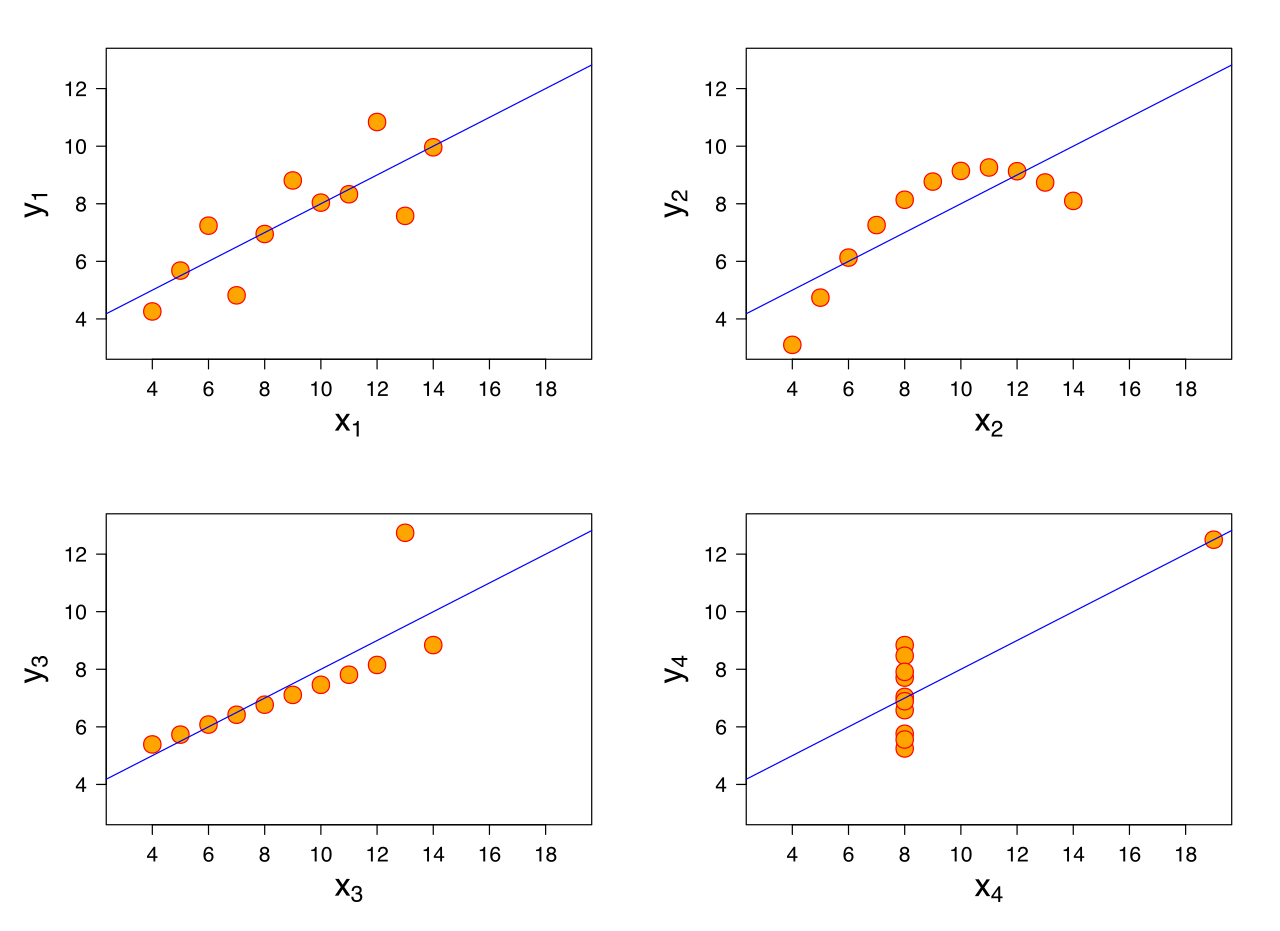
Here is issue one as described by Francis Anscombe, a famous statistician. The following four graphs all have the same regression line even though the data points are wildly different:

As you can see only the regression of the first graph (the blue line) seems right to use intuitively. Even worse, all four graphs have a 100% correlation with each other. That is what is meant by the statement: correlation is not correlation.
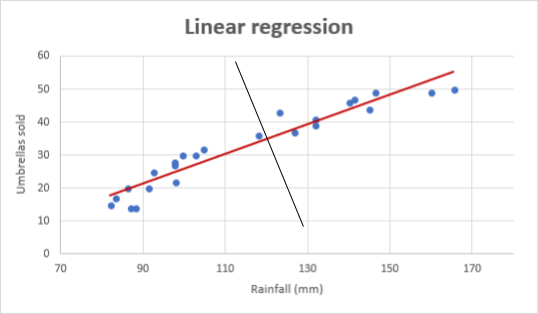
To make matters even worse: the regressions in the above figures all presume that the “real” line (again the blue line) can be calculated by using the horizontal axis. The least square method basically calculates which line would involve the least squares to capture all the data points. Here “the least” is calculated as orientated towards the horizontal axis. Yet, this is completely arbitrary. If one uses the vertical axis the line would be the opposite as shown below. The red line is the normal regression, but there is simply no mathematical argument why the black line is not correct.

Of course in the example above, it looks weird. But the reason is that the red line follows the dots really close. If you have two of those lines you get a very high correlation. So, even though there is no sound argument for it, if the correlation is very high, one can still use it.
So what is a very high correlation? As a rule of thumb, any correlation below 80% is suspect. And yes, we haven’t found that many correlations above 80%. So most correlations are spurious.
Underdetermination also plays a role with correlation. Even if you get a high correlation (>80%), even then due to the underdetermination of theory by data, there are many more theories possible besides your one theory.
Correlations in football
Does this have any real world application in the world of football? The answer is yes! Most correlations in football are less than 80% and should be regarded with a pinch of salt. Furthermore, correlation can be gamed.
Let’s look at any correlation involving a team statistics like xG or Xa. If one finds, for example, a correlation of 50% between team xG and the number of goals scored in the next season, how can that correlation be gamed? Easy! For once, the correlation between the xG of defenders (for instance 0.1) and future goals is very high, because the xG of defenders is very low and they will only score a few goals next season. But the correlation between the xG of strikers and future goals is quite low. We looked at the topscorer for each team in the Dutch Eredivisie and the Belgium Jupiler League and found only a 27% correlation between the xG of the striker before the season and the goals scored during the season.
But if we would combine the high correlation of the defenders in our example with the low correlation of the strikers we found, then one gets about a correlation of 50%, which most of the time is considered a good correlation by people who are less strict than we are.
Most importantly: decision made based on these kinds of correlations have a bigger risk of being the wrong decision than decisions based on higher correlation and less combinations of underlying correlations. Especially, when it comes to recruiting players, basing your decision on the wrong kind of correlations can end up in quite a costly debacle.
No tail information
As Nassim Taleb makes clear almost all correlations lack information about the tails of distributions. Correlations, if useful at all, only tell you something about average players. Yet, football clubs and scouts are looking for exceptional players. It is highly unlikely that you will find exceptional players using correlations as exceptional players are located in the tail of a distribution as they outperform average players.
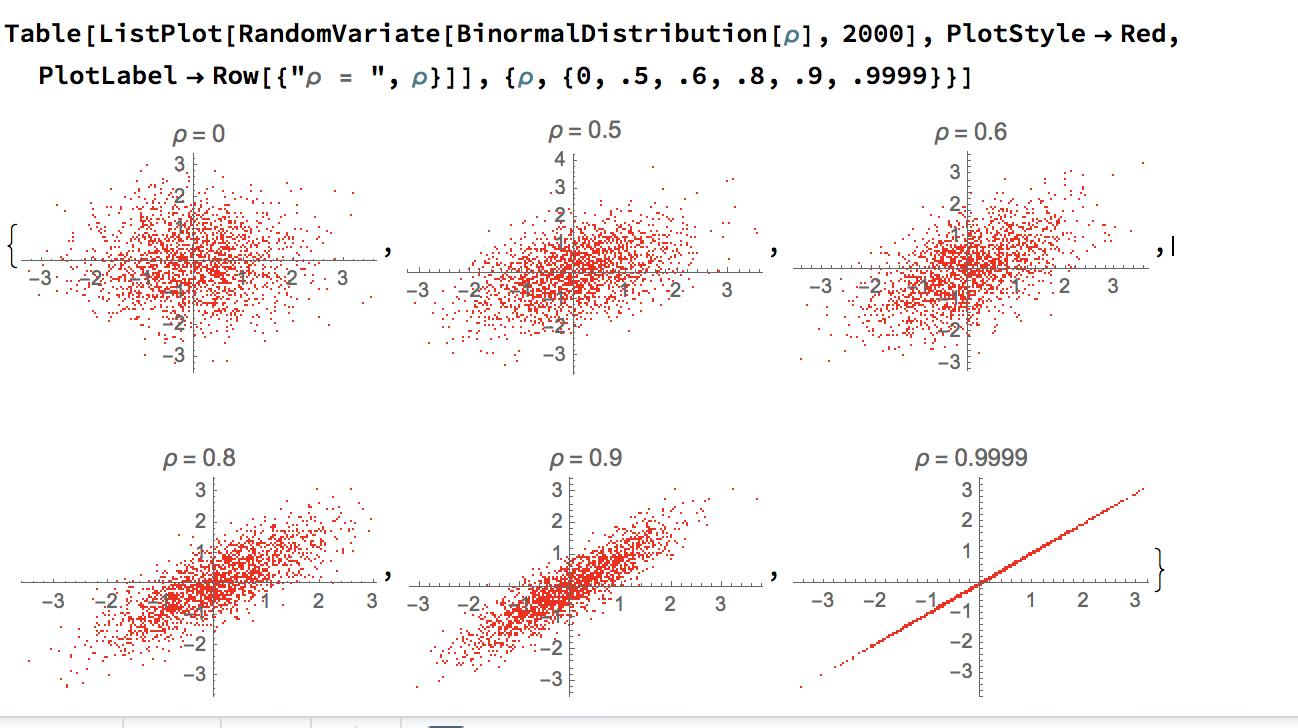
Even in an 50% correlation there really is very little information as can be seen from this graph:

