Everyone has an opinion on the quality of the transfers of their favorite club in the Premier League. But can we actually measure successful transfers? Here is the table of successful and unsuccessful transfers in the Premier League. The explanation follows below:
| Club | Successful transfers | Unsuccessful transfers | Losses per player | Losses per year | Profit per youth player |
| Tottenham Hotspur | 88% | 12% | 5.34 | 1.068 | 5.87 |
| Watford | 84% | 16% | 3.14 | 0.628 | 0 |
| Everton | 84% | 16% | 3.44 | 0.688 | 11.48 |
| Leicester | 84% | 16% | 5.37 | 1.074 | 2.69 |
| Chelsea | 83% | 17% | 4.74 | 0.948 | 4.28 |
| Newcastle | 80% | 20% | 2.8 | 0.56 | 0.28 |
| Bournemouth | 80% | 20% | 2.58 | 0.516 | 0 |
| Brighton | 80% | 20% | 1.8 | 0.36 | 0 |
| Arsenal | 78% | 22% | 7.85 | 1.57 | 4.65 |
| Manchester City | 77% | 23% | 8.28 | 1.656 | 5.98 |
| Sheffield | 76% | 24% | 0.65 | 0.13 | 0.97 |
| Liverpool | 75% | 25% | 10.45 | 2.09 | 10.44 |
| Burnley | 74% | 26% | 1.53 | 0.306 | 0 |
| West Ham | 73% | 27% | 1.83 | 0.366 | 3.46 |
| Huddersfield | 71% | 29% | 1.17 | 0.234 | 1.65 |
| Average | 70% | 30% | 3.93 | 0.79 | 3.49 |
| Cardiff | 70% | 30% | 1.1 | 0.22 | 0 |
| Norwich | 60% | 40% | 3.51 | 0.702 | 5.39 |
| Southampton | 59% | 41% | 6.53 | 1.306 | 6.26 |
| Wolverhamperton | 55% | 45% | 1.4 | 0.28 | 0.51 |
| Crystal Palace | 52% | 48% | 3.23 | 0.646 | 8.25 |
| Manchester United | 52% | 48% | 9.12 | 1.824 | 2.91 |
| Aston Villa | 43% | 57% | 2.51 | 0.502 | 1.9 |
| Fulham | 34% | 66% | 2.17 | 0.434 | 3.53 |
The first column indicates the percentage of successful transfers. Here we mainly mean financial success. We have looked at over 800 players who have left their club in the past five years. The basic idea is that if a club received less money than what they paid for the player then it would be an unsuccessful transfer. The idea being that if he was a success at the club, he would have been worth more.
Of course, there are many exceptions. Especially if the player is playing quite some time for the club. For that reason we used a depreciation formula to decrease the amount paid for the player for each year that he actually played at the club. If a player played 5 years for the club, the transfer would be an automatic success this way/ Loan fees were also taken into account.
The second column indicates the percentage of unsuccessful transfers.
The third column indicates what, on average, an unsuccessful transfer cost the club in the past five years in millions of pounds. The fourth column is this amount divided by 5. This number is basically the amount that the club can spend each year to prevent 1 unsuccessful transfer every 5 years. Adding FBM statistics to your data analysis costs a fraction of this amount. Adding FBM statistics immediately reduces the risk of an unsuccessful transfer because we do our own data acquisition and the FBM approach is completely different than any other data provider. For that reason we are 100% complementary to existing data analysis. With FBM statistics you have another data source to confirm or disconfirm that a player will be a success at the club.
The fifth column is how much money a club has made with the transfers of their own youth players. This is an indication on whether the club ought to concentrate on scouting or youth development or both. As FBM uses Bayesian statistics FBM needs way less data before we can draw well founded conclusions. So FBM statistics is ideal for the youth development program of the club as well as youth scouting.
Some caveats in determining successful transfers
First let me stress that these numbers are an indication. One can always use a slightly different formula to divide transfers between successes and failures. Nevertheless, other approaches will basically show the same picture.
The second point is that only players that have actually left the club are counted. If you think that there are still a lot of bad players on the roster of the club, then it is likely that the club will have worse numbers the year these players leave the club. The opposite is also true. If a club has just shed it’s dead wood, then they will probably do better in the future. But for now, this is how it looks.
Thirdly, and this connects with the second point, the numbers are relatively small. On average we considered about 30 players per club, with only a few of them unsuccessful transfers. That means that if next year a player with an unsuccessful transfer leaves the club, that it will have some impact on these percentages.
Two examples of how FBM Second Opinion would have prevented unsuccessful transfers
Paul Gladon
Paul Gladon transferred for 1.8M pound from Heracles to Wolverhampteron. Here is how FBM statistics view Paul Gladon in his last match for Heracles (see here for an explanation of how to read an FBM contribution chart).
We think that it is quite likely that Wolverhampteron would have saved 1.8M euro if they had seen this chart and all our other data on Gladon.
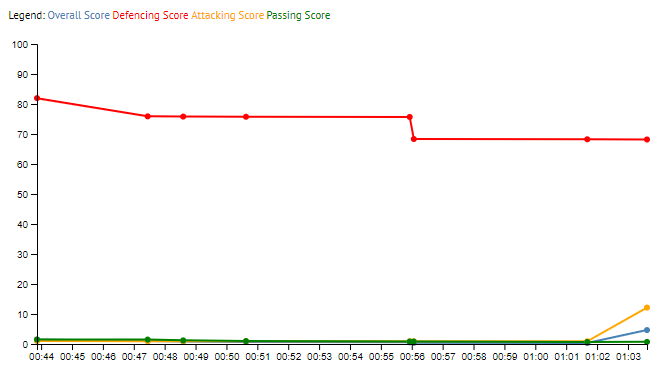
Davy Klaassen
Although Klaassen’s FBM contribution chart is a lot better than Gladon’s chart, it still doesn’t justify the transfer from Ajax to Everton, especially if Everton wanted to use Klaassen to support their attack, rather than their defense:

Very telling is that even though the Netherlands won 5-0 Klaassen’s attack contribution hardly rises. This chart would and all our other data of Klaassen would probably have prevented Everton from misspending 24.3M pound.
Leave a Reply