Many scouts wonder why their advice is being ignored by the higher ups. The reason is that whatever scouting report they have drawn up, their report fails to answer the most important question:
What is the probability that player X is able to contribute to the team?
Time to define “analytics” for nba fans. At least how we do it. 1. Team Analytics – style of play that optimizes your PPP 2. Player Analytics – The probability that a player is able to contribute to maximizing the team PPP
— Mark Cuban (@mcuban) June 20, 2019
The answer is a number between 0% and 100%. This answer is never given in any of the reports or presentation scouts give. That means that the decision makers have to calculate this answer based on the report the scout has provided. Of course, they never do this consciously. Yet, our brain makes these kinds of estimations unconsciously all the time. If a scout does NOT explicitly answer this question, the brain of the decision maker is going to make the probability estimation all by himself. In almost all cases, this estimation will be lower than the players the decision maker prefers himself. That is the reason why even the most successful scouts only have contributed to a handful of transfers. Most transfers happen for other reasons than provided by the scouting team.
It really doesn’t matter whether we are talking about data, video or live scouting. If the final report fails to answer the question about the probability that a player is able to contribute to the team, the decision maker is going to answer that question and probably in a less favorable way.
So let’s look at an example. If you are using data as a data scout, how can you then answer this most important question:
What is the probability that player X is able to contribute to the team?
First you need to build a model that transforms data into probabilities. Bayesian networks are most suitable for this job, but there are other ways. We prefer to use Bayesian networks. Second step is to validate your model. For validation we have created a Bayesian network to transform team data into team probabilities. We calculate the following four probabilities:
- What is the probability that a team is going to perform well?
- What is the probability that the attack of the team is going to perform well?
- What is the probability that the defense of the team is going to perform well?
- What is the probability that the passing game of the team is going to perform well?
Here are the results for the Premier League and Watford:
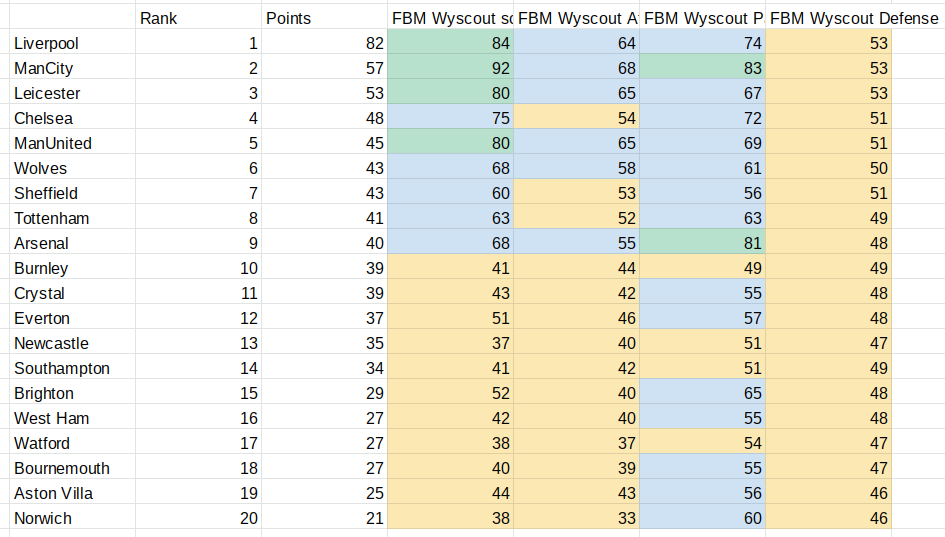
Validation comes from the 89% correlation (R2=80%) between the probability to perform well and the rank of the team. This is in line with this correlation in other competitions. So to be clear:
- The probability of Watford to perform well is 38%
- The probability of Watford to attack well is 37%
- The probability of Watford to defend well is 54%
- The probability of Watford to pass well is 47%
The next step is to look at the individual players of Watford. Normally we would look at all the players (except the keeper), but for this exercise we only look at the most recent starting XI:
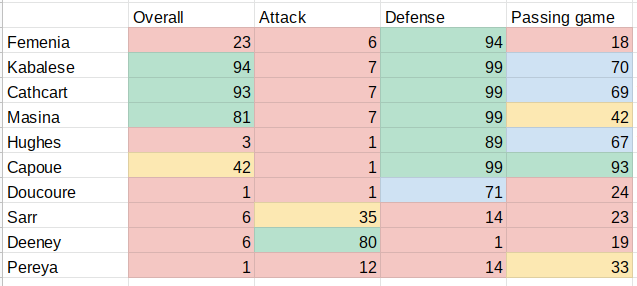
Again, these stats answer the following four questions:
- What is the probability that a player is able to contribute to the team?
- What is the probability that a player is able to the attack of the team?
- What is the probability that a player is able to the defense of the team?
- What is the probability that a player is able to contribute to the passing game of the team?
As long as a player has at least one of these four probabilities quite high, he is an asset to the team. Of course, if it is only one category, he is a specialist rather than a generalist, unless that category is the overall category.
Taking into account minutes played we can then calculate the contribution each player has made to the team probabilities of Watford:

The contribution of these ten players is:
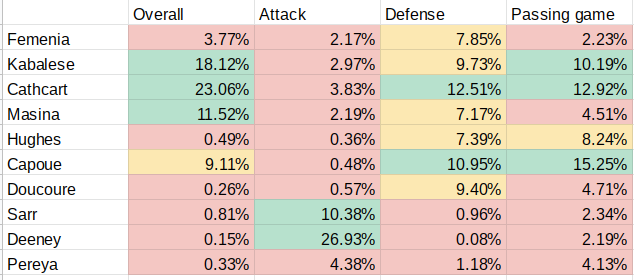
Here one can see that although Sarr has quite weak data, his contribution to the attack of Watford is on par to what is expected of him.
One can also immediately see that Pereya is the weakest link. So let’s look at a replacement for Pereya. As this is an example only, I am going to use a replacement who obviously would be better suited than Pereya. The player I am going to use is Liverpool’s Mané.
Here we use our transfer model. This gives the following results:
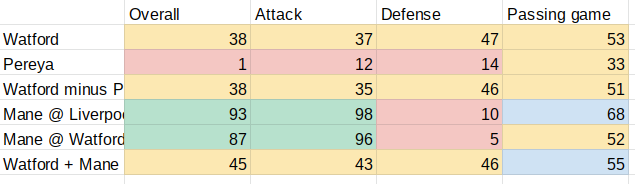
Let me explain this. First we start with the probabilities of Watford and Pereya we have already seen. Taking into account minutes played, we subtract Pereya from the probabilities of Watford. What this means for Watford is that the probability to perform well remains unchanged, but the probabilities to attack, defend and pass well drop a bit.
Then we look at the probabilities of Mané playing at Liverpool. As you can see, for all but defense, these probabilities are much higher than Pereya’s probabilities. But in part, Mané is playing well at Liverpool because he is playing together with other great players. That won’t be the case if he transfers to Watford. So we have to take into account that his performance will drop a bit. But how much? Fortunately, we have a Bayesian model to calculate precisely that by taking into account the relative strength of both teams and minutes played. To make it explicit:
- The probability that Mané is able to contribute to Watford is 87%.
- The probability that Mané is able to contribute to the attack of Watford is 98%.
- The probability that Mané is able to contribute to the defense Watford is 5%.
- The probability that Mané is able to contribute to the passing game of Watford is 52%.
What this would mean for Watford is that their probabilities also go up when we add Mané with his Watford probabilities to Watford as is shown in the final row. With Mané playing for Watford the new probabilities for Watford are:
- The probability of Watford to perform well is 45%
- The probability of Watford to attack well is 43%
- The probability of Watford to defend well is 46%
- The probability of Watford to pass well is 55%
GIven the correlation between overall team performance probability and rank, we can also see that Watford would rise to somewhere between rank 10 and rank 15 in the competition once Mané is playing for Watford.
Rational decision makers use these kinds of models to calculate for every player they are seriously considering hiring what the probability is that the player is able to contribute to the team and what this means for the team. Once you have ranked all players according to their probability to be able to contribute to the team, you try to hire the best player available. That is how we were able to transfer Dalmau to Heracles for instance.
This is the kind of work that we are going to teach at the Football Behavior Management summer school at the VU-university in Amsterdam in juli 2020. Due to the current circumstances this will be an online course.
Leave a Reply